Optimizing Font Loading, LCP, and 3rd Party Script Loading
When Inline CSS Boosts SEO
Published 3/4/2025
Why It Matters
(Skip ahead if you just want the nerdy goodness)
Google's Lighthouse audit tool is one way to evaluate the performance of a website. The better a website performs, the better advantage it has against similar sites in search results. It's not necessarily something that will boost you to the top of page 1 on Google, but it could be a tie-breaker. This breakdown documents the technical discovery of why my blog was underperforming, and how I fixed the issue.
Backstory
While building out "The Archives" section of my website, I decided to check up on my performance metrics. The site has historically been very fast due to the tech stack I prefer using (SSG SvelteKit, CloudFlare, etc) but as the design elements have evolved, I've not always stayed on top of the nitty gritty performance numbers.
To my dismay, after switching to the fantastic Satoshi font from fontshare.com and integrating Google Analytics, my performance numbers suffered a significant blow.

I was able to search and destroy the accessibility issue relatively quickly, but the performance issues were a little more involved.
Root Cause Analysis
Digging into the Lighthouse report in depth, I found that my LCP (largest contentful paint) metric was the main issue for the performance penalty.

This is pretty common – the reason it surprised me in this context is that the page had no images! Virtually every other time I've seen this complaint from Lighthouse, it's been because there are unoptimized images loading slowly and they take up a large portion of the page.
But this is just text! Lighthouse provided a screenshot of the offending LCP-slowing element:

Not to mention, the horrific render delay numbers:

Granted, this was with throttled 4G network simulation, but still. Unacceptable! I dug into the Google Dev docs to figure out why my text content was performing so poorly, and the results surprised me.
The More I Know, the Less I Know
First thing, the docs recommend using WOFF2 exclusively in 2025. That's news to me, but I'm happy to drop the other font-face declaration formats. I made the change - no impact on performance. Darn.
Next, the docs recommend self hosting fonts – check! I always self host. So it's not that.
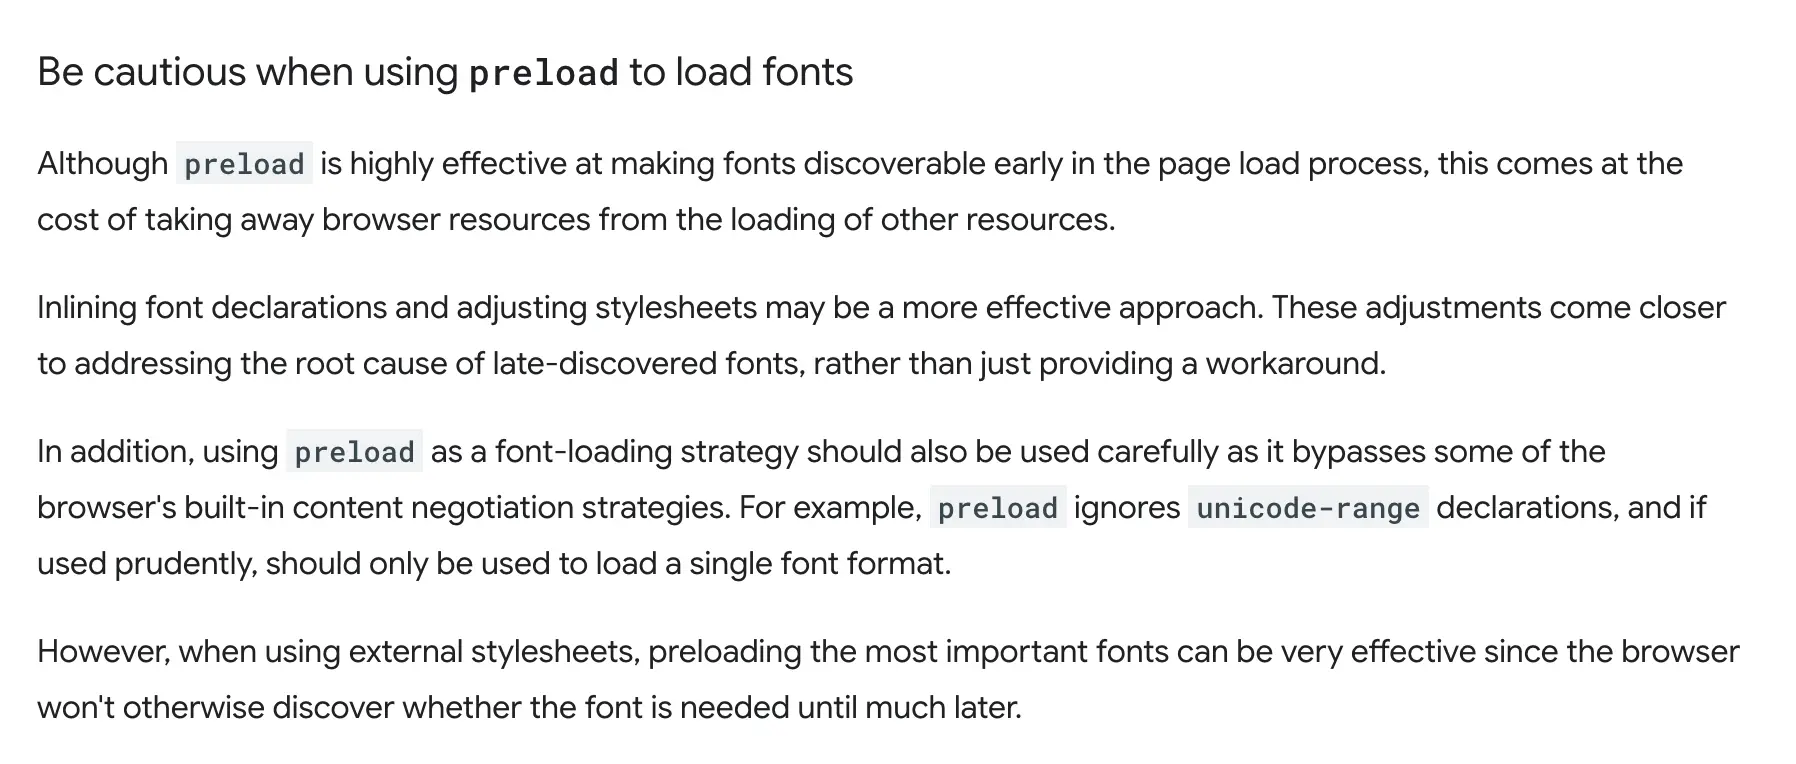
The next item surprised me:

Be cautious using preload? I had just started making it a blanket rule to use preload because it has consistently helped performance! How could it betray me?
The TLDR here is that preload is a double edged sword - it can cause noticeable performance improvements if all of your CSS font styling is happening in external stylesheets. But what is the one thing that will always outperform external styles? Inline styles!
Inline Heretical Statements
"Inline" is practically a dirty word in web development in 2025, but if you can create structure and intention behind how you strategize if and when to inline, you can keep your code clean, while turning over every stone on the technical implementation side of things. Ultimately the browser is a runtime, and there is still plenty of opportunity to hack it's insides for maximum performance.
So, I moved my font declarations and loading to the head of the root HTML layout in my SvelteKit project. Lo and behold, progress!

Why This Works
When a browser receives HTML in response to a request, it has to parse it before the page actually gets rendered. Part of this process involves constructing the CSSOM - CSS Object Model. It's like the DOM we all know and love, but for CSS instead of HTML.
When I inlined the font-face declarations, the browser was not only able to start loading the font files early, in parallel with other requests, but also had a jump start on constructing the CSSOM, with the context that it would be using Satoshi for all body text, and the specifics of how to configure the typeface.
The CSSOM effect is negligible in reality though; the fact that it could start loading the font immediately after encountering it early in the HTML file instead of after it received the main CSS stylesheet is likely what did the trick. It reduced the wait for rendering from 3 requests (HTML -> CSS -> font) to 2 (HTML -> font), saving the entire round trip wait to grab the CSS, as well as the time to parse it once received.
Now, how do I squeeze out the last 8%?
Digging into Lighthouse again, the villain was... Google? I guess they did drop the whole "don't be evil" thing.
The Google Analytics script itself was causing the site to render slowly. Why is GA so massive? I don't know. I wanted to keep it, but needed to solve the performance issue.
That ended up being an easy fix; I swapped the async that comes on the embed code by default to defer, and tossed it at the bottom of the body instead of the head. In the weeks since, I can confirm that I am still getting correct data, and behold:

Sweet victory!
Close enough. Lighthouse varies a bit each time its run. I've seen perfect 100s, as well as 99s, 98s on performance. Good enough for me!